Using the DebuggerDisplay attribute for better debugging experience
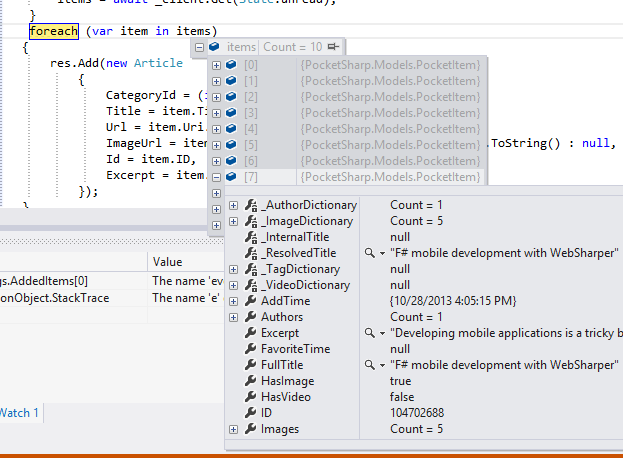
When debugging a C# program in Visual Studio, I tend to always hover over the variables to glance at their values and structure instead of explicitly writing their names into the watch window. If I want to explore say a collection, I need to unfold each of the items using the + button to get an idea about the data:
This is not very comfortable, so thankfully, there is a way to make this experience better, using the DebuggerDisplay attribute. This attribute can be applied to any class (and struct, enum, property, field, delegate, assembly) and allows you to define the information about the class you want to to see in the debugger.
Give the attribute a string to be displayed and in this string you can reference any data from the class:
 [DebuggerDisplay("ID = {ID} | Title = {Title}")]
 public class PocketItem
 {
   public int ID {get;set;}
   public string Title {get;set;}
 }
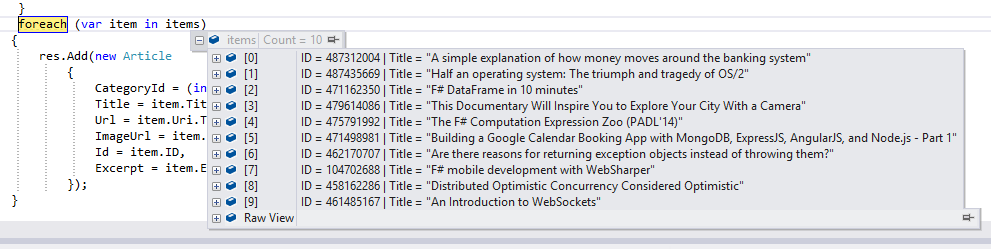
When you hover over the data now, you will see a nice readable “labels”:
If you do not want to add the DebuggerDisplay attribute to all your classes manually, you can use the Visualize addin for Fody. Visualize will add the DebuggerDisplay attribute to all your classes, using all the classes’ properties in the “label”.
Warning: showing this “labels” takes some time, so do not reference to many data fields.
See also
- Visual Studio extensions to make your life easier
- Quick Tip: Showing solution branch name in Visual Studio title
- Changing the PivotItem header color in Windows Phone 8.1 XAML
- Dialog helper for Universal Apps the easy way
- Creating a fake splashscreen for your Universal App